
Generation 2 of Entropy Analysis in FouAnalytics

Generation 2 of our entropy analysis incoming to #FouAnalytics
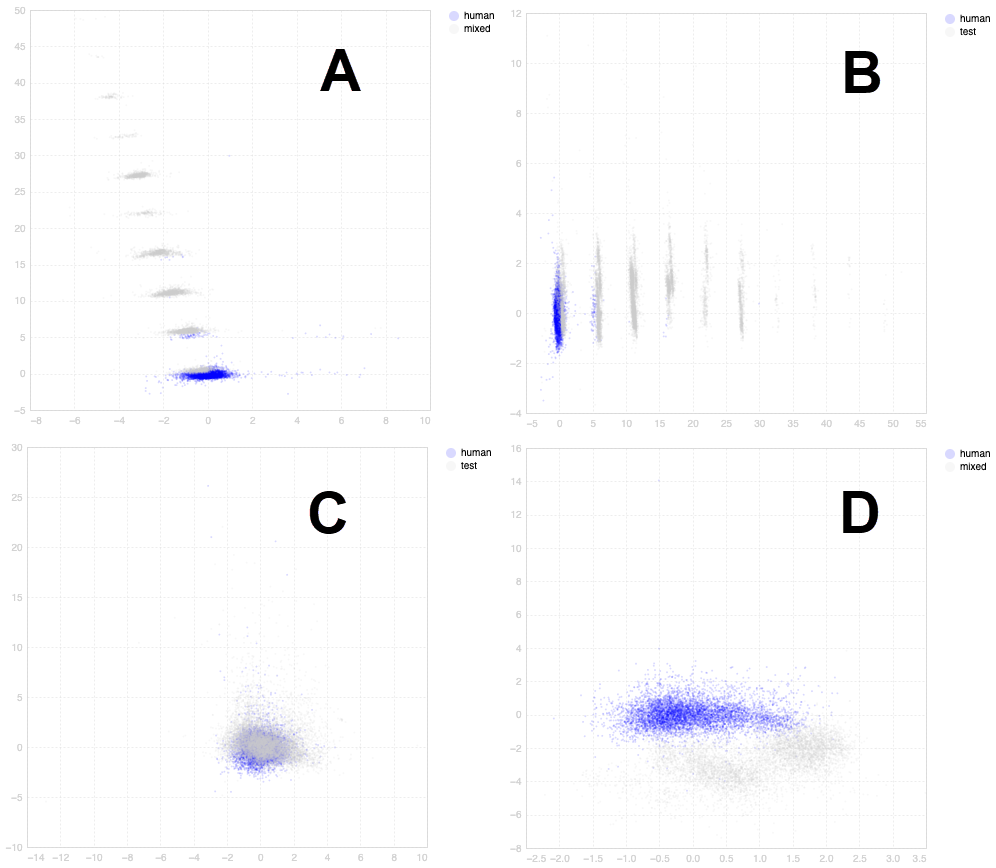
see if you can tell which scatterplot below shows campaign data (gray dots) overlapping with human truth set (blue dots). If they overlap with human truth set data, we assign blue flags. If the campaign data overlaps with bot truth set data points, we assign red flags.
Gen1 described here
Entropy Analysis—How We Use It For Bot (And Human) Detection
We compare our entropy analysis labeled impressions to both human and bot truth sets. The gray dots are the individual impressions from campaigns; we determine if they overlap with blue (humans) or red (bots). We ignore the purple in the middle because the signal is not clear enough.

Excerpting:
Why It’s Hard for Bots To Avoid Our Detection
Ok, let me now bring this back to more simple terms and explain why it’s much harder for bots to trick our detection. When bot makers create bots from headless browsers in data centers, they have to declare parameters like screen resolution, browser type, language, plugins, etc. When writing code, it is easy to declare a single value and use it repeatedly, or declare a random function. For the most part, bot makers today randomly rotate through lists of possible values, because using the same value over and over is too easy to catch. That said, the following principle holds true for anomaly detection - “if it’s too ordered (same value) or too random, something is wrong.” By using the normal curves above, in one, two, or N dimensions, we can see when something is “too ordered” or “too random.” We can also see if the value is “normal” - actually falls within what is expected.