
Formatting Average Session Duration (or any time-based metric) in MS Excel - QUICK TIP
A handy trick to format a number into a time/duration metric.

While I try to wrangle most of my reporting into Dashboards I still find myself having to produce reports using MS Excel frequently. This is a very short but (in my mind!) useful MS Excel/Google Analytics data trick.
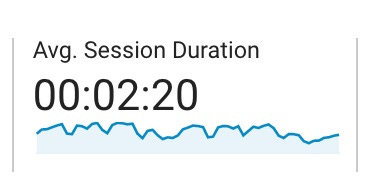
In Google Analytics, a key metric is "average session duration", the average time a site visitor dwells on the site. It is one of several indicators that can help you evaluate whether or not a visitor was engaged or even a real human (durations of less than a second or two are suspect!). When viewing the metric within Google Analytics, you see something like the following:
When you export it to an excel file (.xls) or a comma delimited file (.csv) you see the following in the spreadsheet:
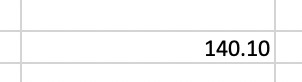
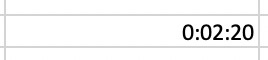
The data is identical, of course. For reporting purposes, I like to have the 140.1 seconds display in a time format like:
If you attempt to just format 140.1 seconds as time format in excel, it won't read properly. It took me a bit of time (perhaps too long) to figure it out (I couldn't find a solution on the internet!). Here is the trick:
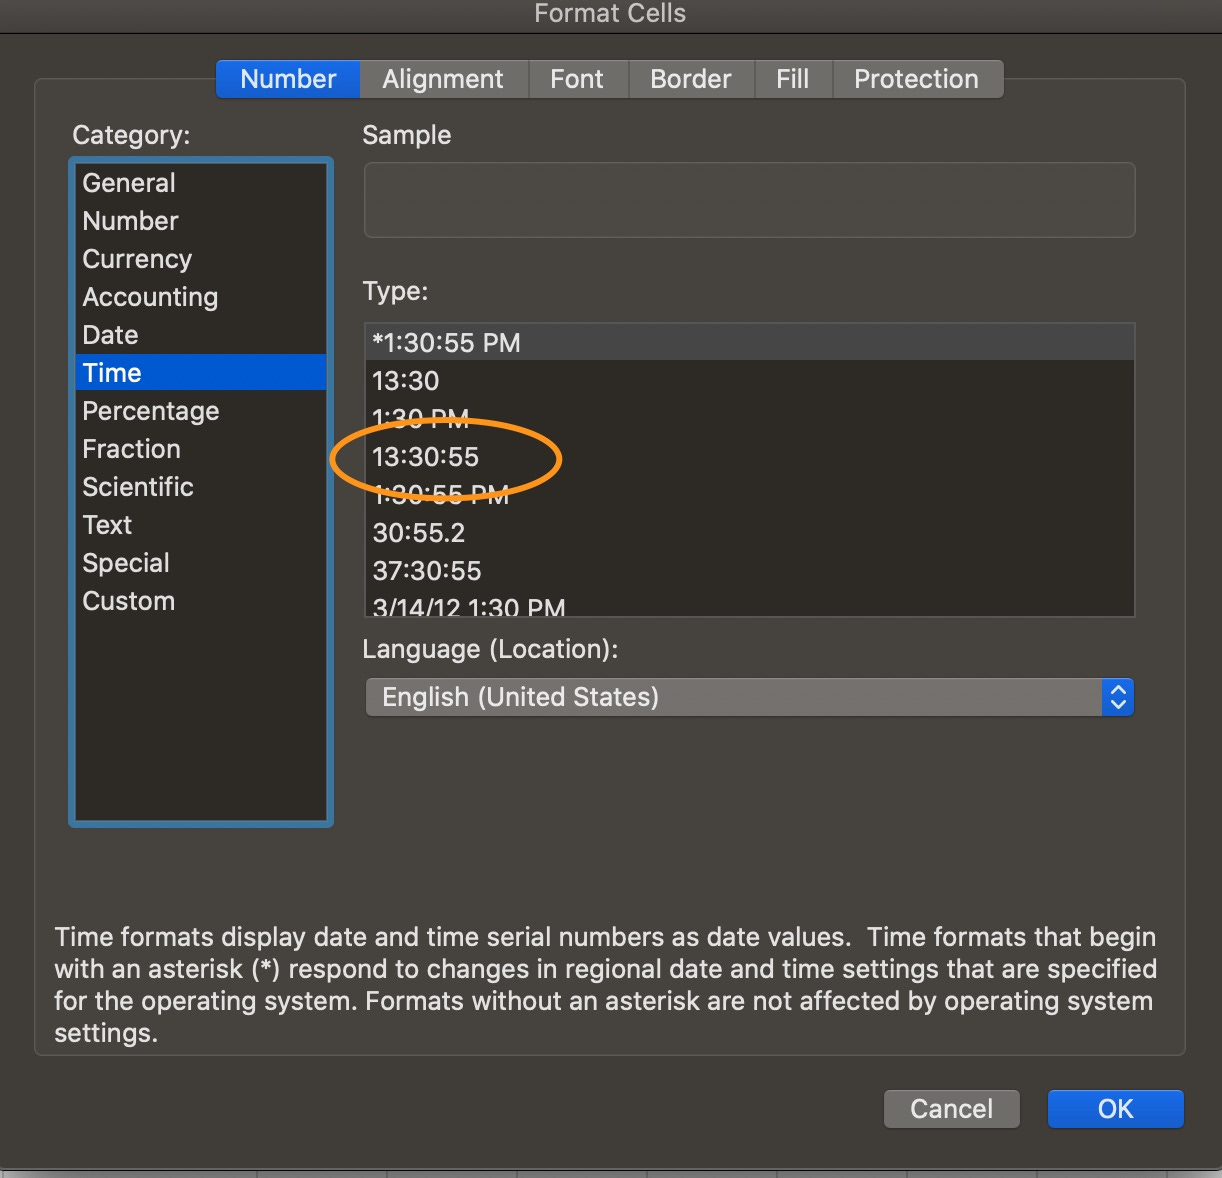
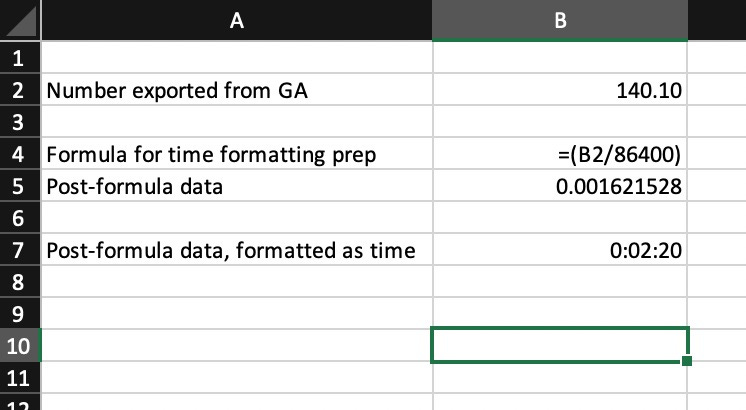
Divide your average session duration expressed as a number (in our example, 140.1) by the number of seconds in a day, 86,400 (24 hours x 60 minutes x 60 seconds) and then format it to a time format in excel as follows and it will be neatly formatted:
In summary, here is what it should look like in your spreadsheet:
And that is the trick! Let me know if you have a cool tip!