
Optimize for Humans and Away From Bots with FouAnalytics

Other fraud detection vendors only measure for IVT (invalid traffic). They don’t measure for humans. So when they tell you there’s only 0.6% IVT, it doesn’t mean the other 99.4% is human, or even OK. It just means they don’t know about the other 99.4% and you should NOT assume it is OK.
FouAnalytics has positively detected for humans since the very beginning. This is because even if a user was not detected to be a bot, we must positively confirm it is a human; we can’t just assume it is fine. That’s why you see dark blue (humans) and dark red (bots) in our charts. Smart marketers using FouAnalytics are not just avoiding bots, they are also actively optimizing towards humans.
Here are some pointers on how to do that.
Full Funnel Measurement
Previously, I have shown you how some advertisers use FouAnalytics to measure “full funnel” — from the ad impressions, to clicks that arrive on the landing pages, and finally those users that “convert.” By measuring the ads, we can see where they went and whether they were fraudulently loaded by bots or other fraudulent techniques like ad stacking, pixel stuffing, pop-unders, forced redirects, etc. Then by measuring on the landing pages, we can corroborate not only the quantity of clicks that arrived, but also whether they were bots or humans. And finally, in the chart below, you can see most of the conversions are by humans (bots don’t spent money, they make money by doing fraud).

Better Media = Better Outcomes
Obviously, if you start with better quality media, you will get better and more outcomes. For example in the slide below, you can see that in A, there are far more humans (dark blue) and lower bots (dark red) than in B. If you read to the right, you can see there are more arrivals from A and the quality of the arrivals is better — i.e. more dark blue (humans). In B, there is still dark blue, but there is also a lot more dark red (bots) and more white (not measurable). This translates to FEWER clicks that arrive on the site, and of those clicks fewer are human (dark blue). All of this leads to conversions. But you can see that the quantity of conversions, business outcomes from A is 30X more than from B, because only humans convert.

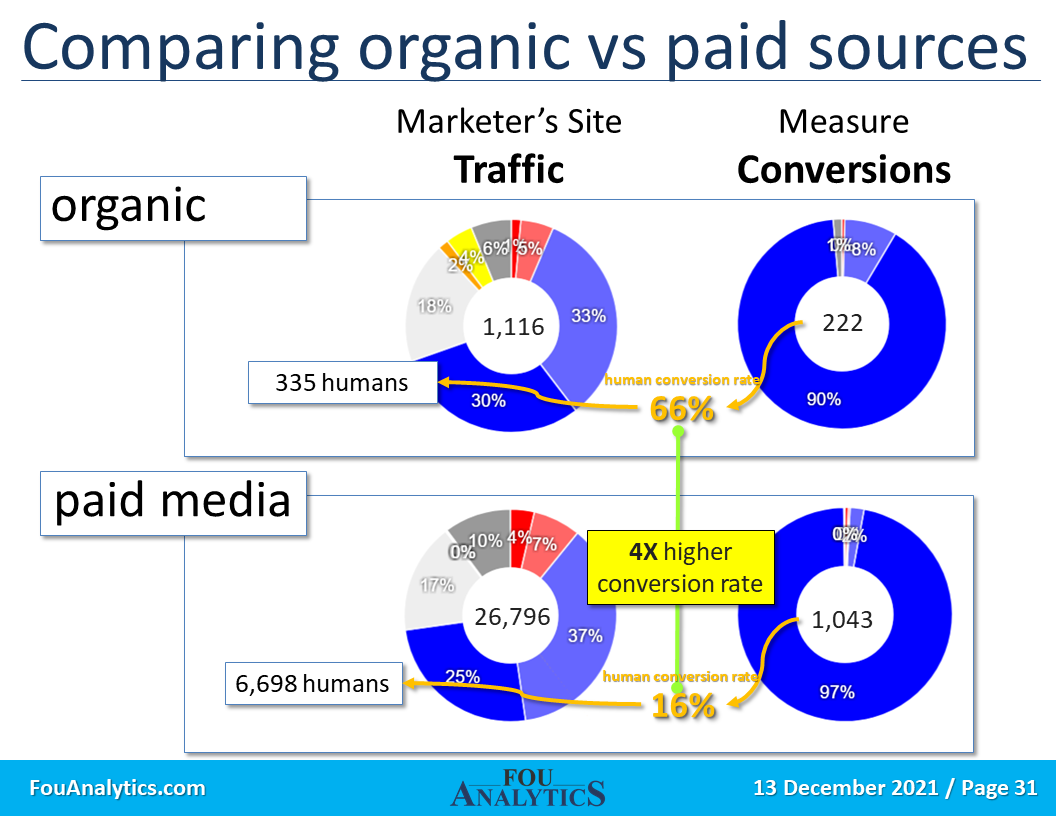
Organic is Usually Better Than Paid
Too many marketers are just trying to “buy” traffic, thinking there are shortcuts to proper marketing. So they allocate most of their budget to paid media, usually with the idea of “more is better.” More ads, more clicks, more conversions. But that’s usually not the case any more, since modern humans are savvy and won’t just take your word for it, and buy your item after seeing an ad. Further humans block ads and don’t click ads that much, even if they see them. Marketers to ensure that they don’t under-invest in content, which is helpful to users as they look for more information to support their own purchase journeys. Investing in content yields payouts over the long term, while every dollar spent in paid is used up the moment the ad finishes airing. Noting the slide below, organic traffic converts 4X better than users arriving from paid. This is because the user was looking for something, found something useful on your site, and then went on to convert. Of course, “paid” is important too — note the extra volume it generated. So every marketer should find the right balance for their own industry, product category, and business outcome needs.
Relative Quality of Paid Display Sources
Since we have FouAnalytics code on the landing pages, we can compare the quality of the clicks arriving from various paid media sources. In the example below, we compare 4 different display sources. We can not only see the relative quality of the clicks that arrive, we can also specifically see the number of humans that arrive. Then, of those humans, how many actually converted. Again, note all the dark blue in the conversion column — humans convert. Then by comparing the quantity that converted to the number of humans that arrived we see the “human conversion rate.” This clearly shows “Display 1” converted at 4 - 8X higher rate than the other display sources. Hint: Display 1 is Facebook display ads, with FAN turned off. So again by verifying for humans using FouAnalytics, we are well on our way towards truly optimizing digital campaigns, not just trying to detect our way out of bot infested programmatic inventory.

Increase Conversion Rates by Making Data More Accurate
Finally, do you ever wonder why conversion rates appear to suck all around? Well, that may be an indicator that you have bot traffic and fake bot clicks coming to your site. Conversion rates are number of conversions divided by traffic that arrived on the site. But what if the denominator was artificially inflated due to bot traffic? You can’t tell that from Google Analytics or Adobe Analytics because they don’t report what portion of the traffic is bots. With FouAnalytics, you can see the bots and how much there were. Not only can you then see where they came from and turn off those fraudulent sources, you can also use that information to adjust and correct your denominator. By excluding the bot traffic from the denominator, you instantly get higher conversion rates — because the number of conversions doesn’t change, but the denominator is now more accurate without the bot visits.

So What?
While everyone else is frantically trying to detect their way out of trouble using bot detection tech, and failing (because that tech sucks and can’t detect anything), you can focus on optimizing for humans instead. Hopefully the above examples show you how some marketers are optimizing towards humans, in addition to away from bots. This is uniquely enabled by FouAnalytics because we have positively detected for humans since the beginning, neatly 10 yrs ago when I started building this platform. See how we do this in Gen 2 of Entropy Analysis -
